suppressMessages(library(tidyverse))suppressMessages(library(glue))PRE ="/c/Users/Saideep/Box/imlab-data/data-Github/Daily-Blog-Sai"## COPY THE DATE AND SLUG fields FROM THE HEADERSLUG="single-tss-centering"## copy the slug from the headerbDATE='2023-03-22'## copy the date from the blog's header hereDATA =glue("{PRE}/{bDATE}-{SLUG}")if(!file.exists(DATA)) system(glue::glue("mkdir {DATA}"))WORK=DATA
Context
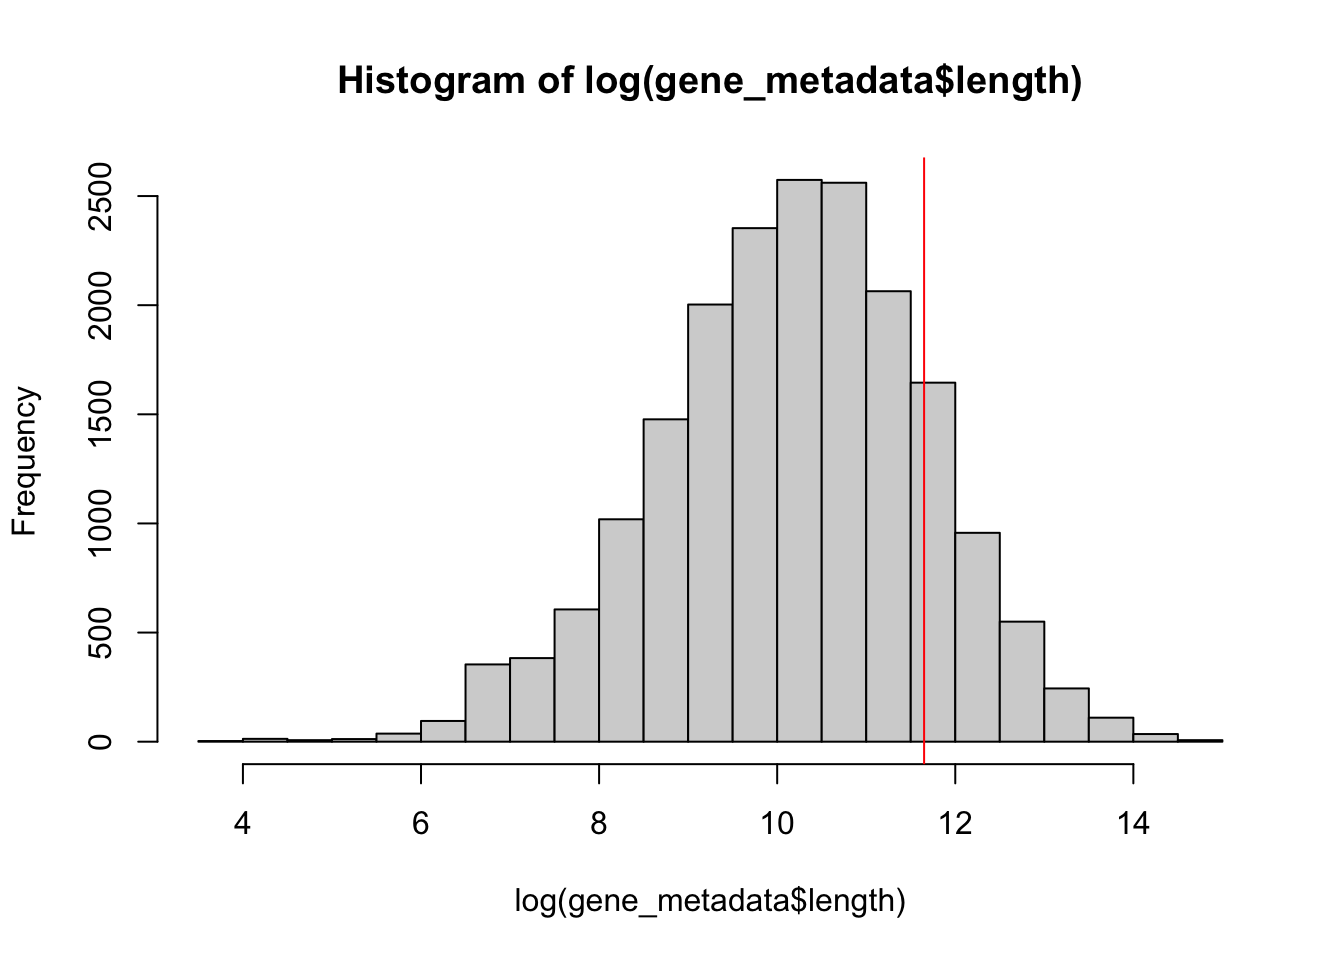
Thus far, I have been running my gene expression estimates by centering the Enformer window on the gene body as a whole. This is then followed by quantification by summing across TSS sites for that gene to yield a single gene estimate. One issue with this is that it becomes difficult to deal with very large genes relative to the Enformer output window. The problem is illustrated below:
print(paste("Number of protein-coding genes:",nrow(gene_metadata)))
[1] "Number of protein-coding genes: 19109"
Code
print(paste("Number of protein-coding genes smaller than enformer output window:",nrow(gene_metadata[gene_metadata$length <114688,])))
[1] "Number of protein-coding genes smaller than enformer output window: 16102"
Code
print(paste("Proportion of genes too large for Enformer:",nrow(gene_metadata[gene_metadata$length >114688,])/nrow(gene_metadata)))
[1] "Proportion of genes too large for Enformer: 0.157360406091371"
As you can see ~15% of these genes are already too large for the Enformer output window.
To remedy this, we can instead make predictions using the primary TSS for genes as the focal point for making predictions. This has the drawback that you can only guarantee quantification at this TSS. While I have previously shown that this estimate correlates strongly with summing across all TSS, they are not exactly the same.
Regardless, here I will modify the pipeline inputs to center on the primary TSS so that more genes are viable for prediction.
How close are gene start positions and “first” TSS for that gene?
Gene start positions and TSS sites are extracted from a reference GFF file. The extraction process is as follow:
For each line, determine if the feature (3rd column) is a “gene” or “transcript”
If “gene”, parse out the genomic location (chr,start,end) as well as the gene id and gene name and store
If “transcript”, store the start location in the set corresponding to the gene with matching gene id
Finally, write out per gene the gene body location and a list of TSS for transcripts corresponding to the gene
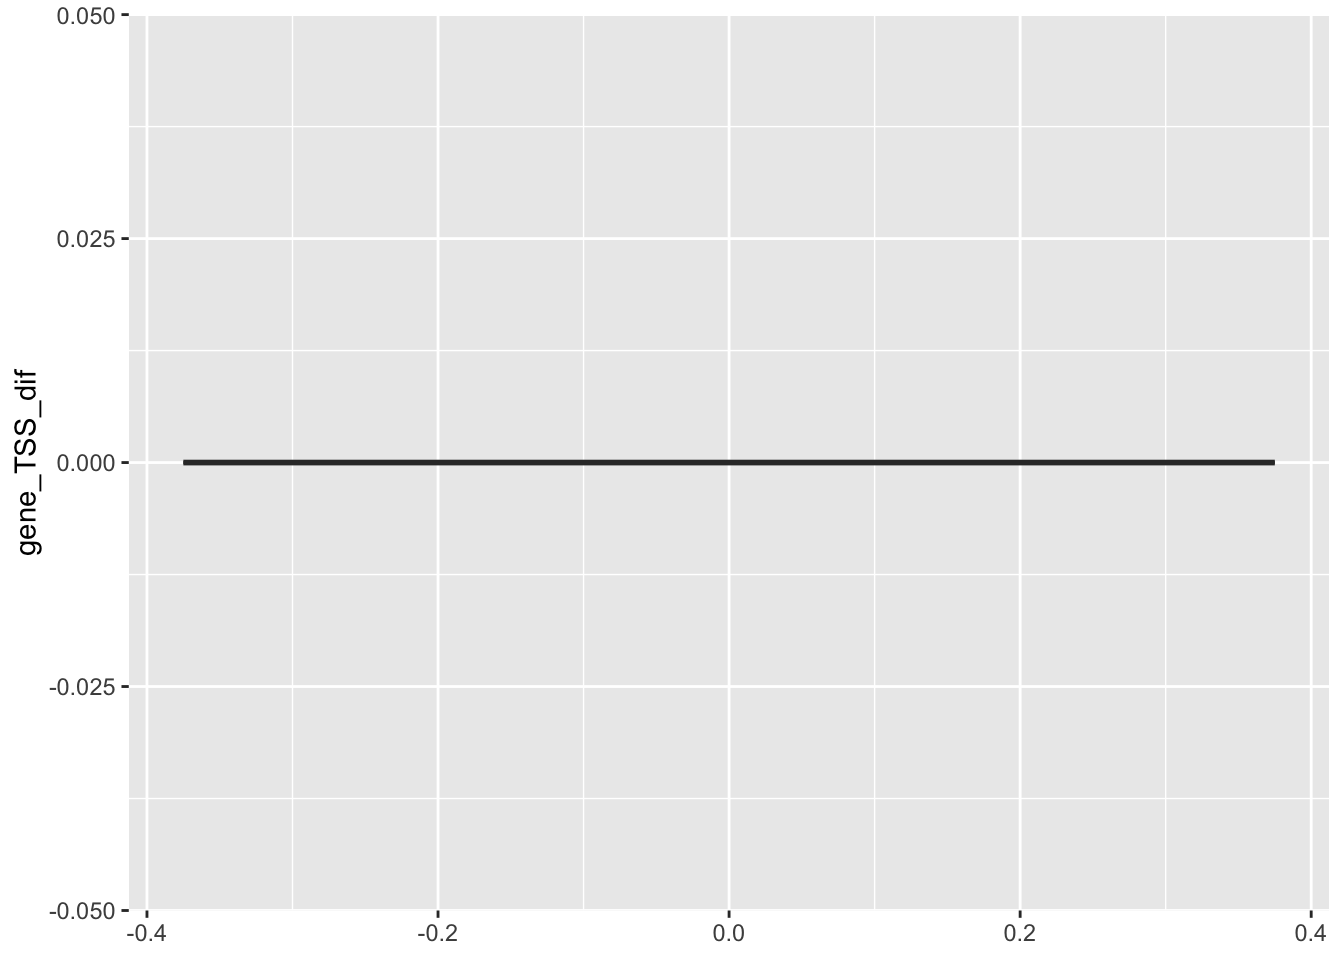
For a variety of reasons, the start of the gene body in the annotation file does not necessarily match the first transcript start location. Below shows the distance distribution between these two classes of loci:
Results from this run will be stored in the following directory:
Geneset enrichment using Karl’s method
I have sent Karl genesets from my epistasis analysis, so more to come on that front.
Hackathon Food Planning
Breakfast: Dunkin Donuts Lunch: Yassa
Source Code
---title: "Single TSS Centering"author: "Saideep Gona"date: "2023-03-22"format: html: code-fold: true code-summary: "Show the code"execute: freeze: true warning: false---```{r}#| label: Set up box storage directorysuppressMessages(library(tidyverse))suppressMessages(library(glue))PRE ="/c/Users/Saideep/Box/imlab-data/data-Github/Daily-Blog-Sai"## COPY THE DATE AND SLUG fields FROM THE HEADERSLUG="single-tss-centering"## copy the slug from the headerbDATE='2023-03-22'## copy the date from the blog's header hereDATA =glue("{PRE}/{bDATE}-{SLUG}")if(!file.exists(DATA)) system(glue::glue("mkdir {DATA}"))WORK=DATA```# ContextThus far, I have been running my gene expression estimates by centering the Enformer window on the gene body as a whole. This is then followed by quantification by summing across TSS sites for that gene to yield a single gene estimate. One issue with this is that it becomes difficult to deal with very large genes relative to the Enformer output window. The problem is illustrated below:```{r}gene_metadata =read.csv2("/Users/sgona/Library/CloudStorage/Box-Box/imlab-data/data-Github/analysis-Sai/metadata/gene_metadata_full.csv")hist(log(gene_metadata$length), breaks =30)abline(v=log(114688),col="red")print(paste("Number of protein-coding genes:",nrow(gene_metadata)))print(paste("Number of protein-coding genes smaller than enformer output window:",nrow(gene_metadata[gene_metadata$length <114688,])))print(paste("Proportion of genes too large for Enformer:",nrow(gene_metadata[gene_metadata$length >114688,])/nrow(gene_metadata)))```As you can see \~15% of these genes are already too large for the Enformer output window.To remedy this, we can instead make predictions using the primary TSS for genes as the focal point for making predictions. This has the drawback that you can only guarantee quantification at this TSS. While I have previously shown that this estimate correlates strongly with summing across all TSS, they are not exactly the same.Regardless, here I will modify the pipeline inputs to center on the primary TSS so that more genes are viable for prediction.### How close are gene start positions and "first" TSS for that gene?Gene start positions and TSS sites are extracted from a reference GFF file. The extraction process is as follow:1. For each line, determine if the feature (3rd column) is a "gene" or "transcript"2. If "gene", parse out the genomic location (chr,start,end) as well as the gene id and gene name and store3. If "transcript", store the start location in the set corresponding to the gene with matching gene id4. Finally, write out per gene the gene body location and a list of TSS for transcripts corresponding to the geneFor a variety of reasons, the start of the gene body in the annotation file does not necessarily match the first transcript start location. Below shows the distance distribution between these two classes of loci:```{r}library(ggplot2)gene_metadata$first_TSS <-as.numeric(sapply(str_split(gene_metadata$tss_sites, ","),"[[",1))gene_metadata$gene_TSS_dif <- gene_metadata$start - gene_metadata$first_TSSggplot(gene_metadata) +geom_boxplot(aes(y=gene_TSS_dif))```### Checking if the "first" TSS is the dominant one### Location of new runResults from this run will be stored in the following directory:## Geneset enrichment using Karl's methodI have sent Karl genesets from my epistasis analysis, so more to come on that front.### Hackathon Food PlanningBreakfast: Dunkin DonutsLunch: Yassa