suppressMessages(library(tidyverse))suppressMessages(library(glue))PRE ="/Users/saideepgona/Library/CloudStorage/Box-Box/imlab-data/data-Github/Daily-Blog-Sai"## COPY THE DATE AND SLUG fields FROM THE HEADERSLUG="quantifying_tss_expression_across_sites"## copy the slug from the headerbDATE='2023-04-17'## copy the date from the blog's header hereDATA =glue("{PRE}/{bDATE}-{SLUG}")if(!file.exists(DATA)) system(glue::glue("mkdir {DATA}"))WORK=DATA
Context
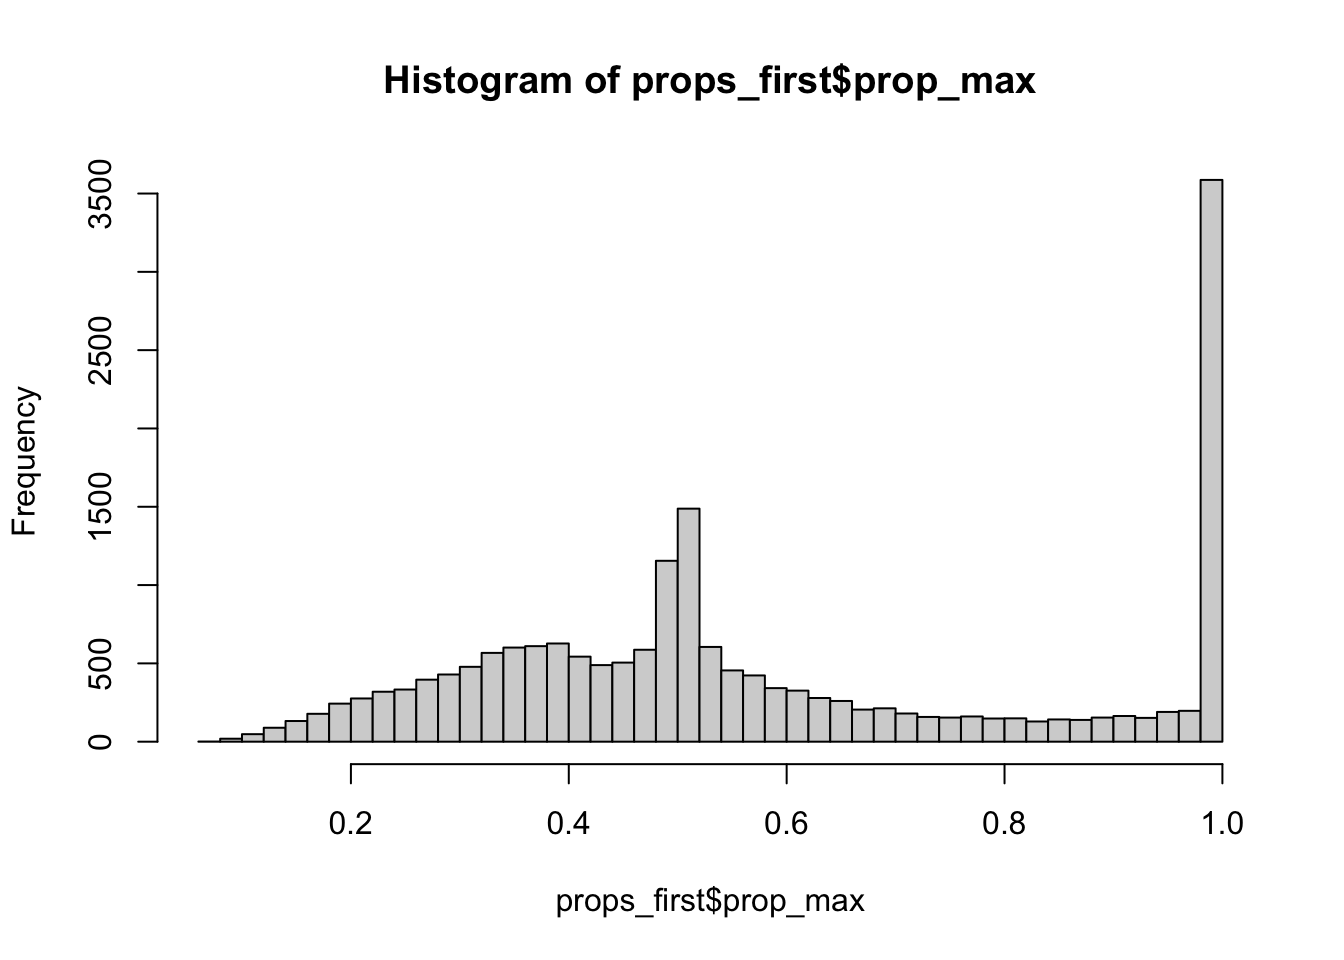
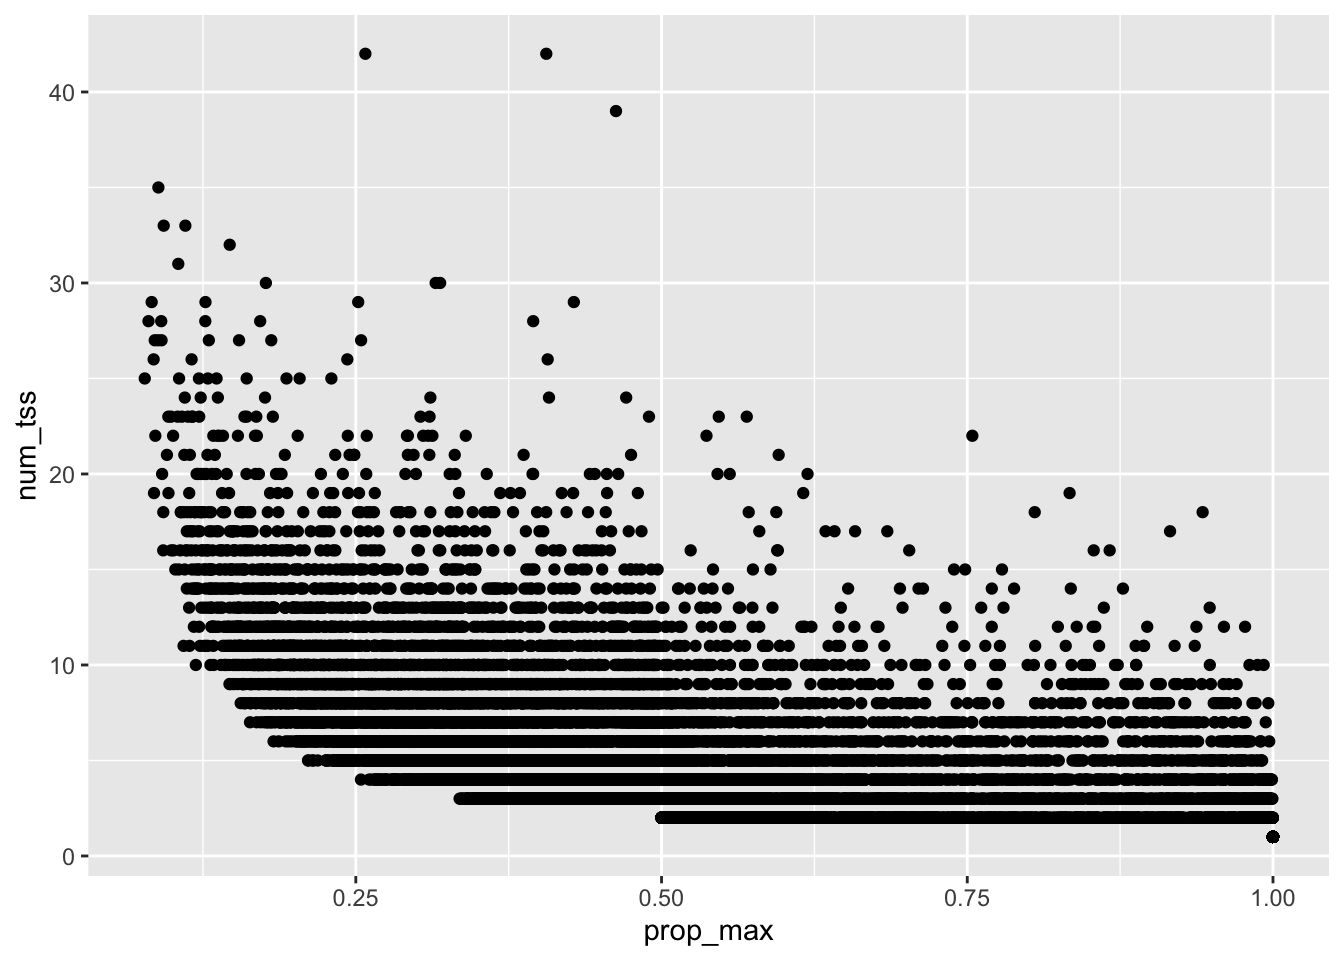
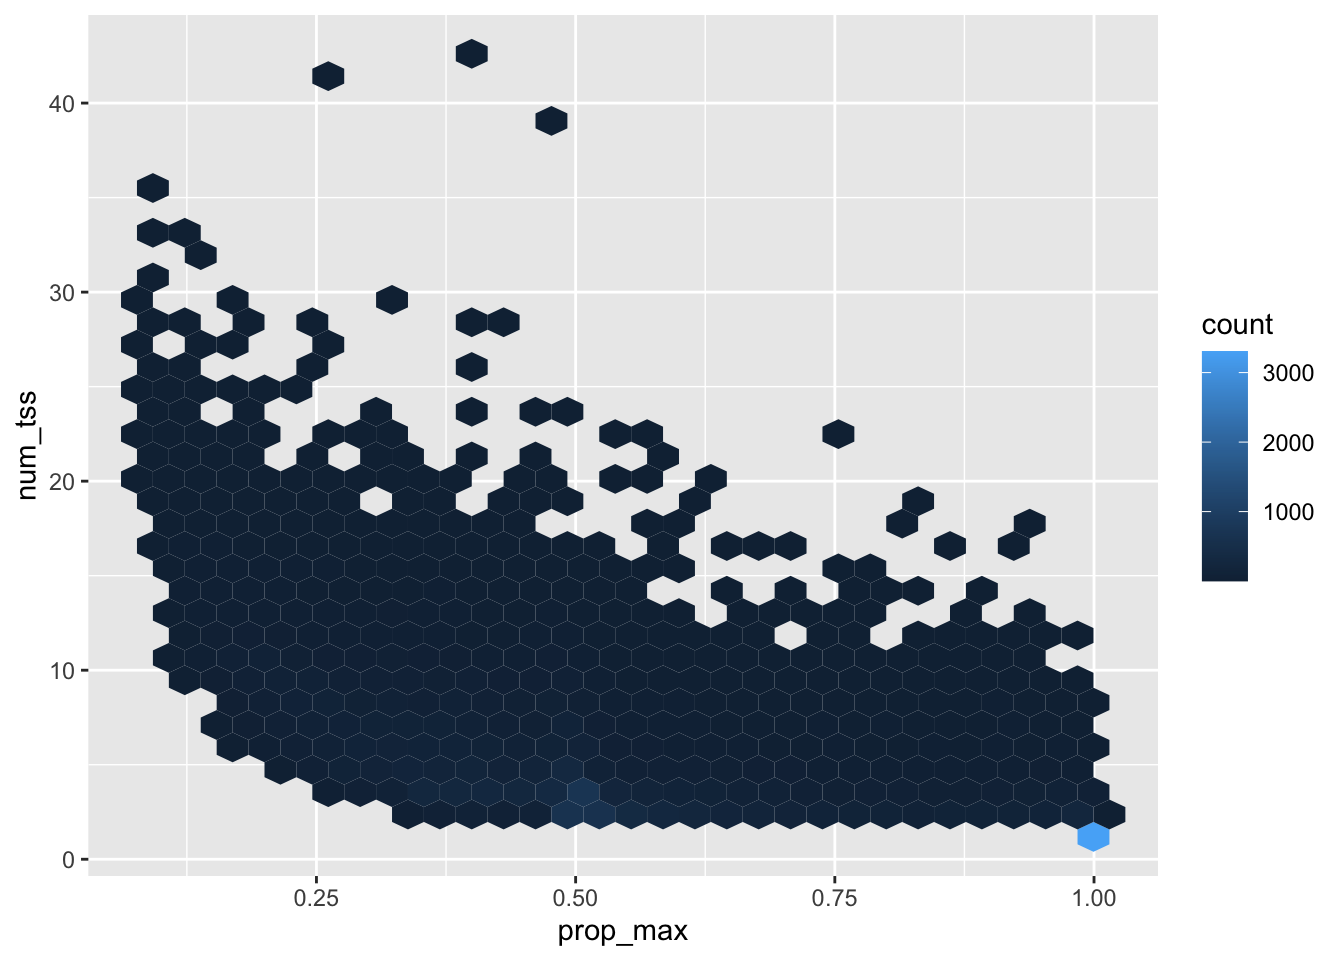
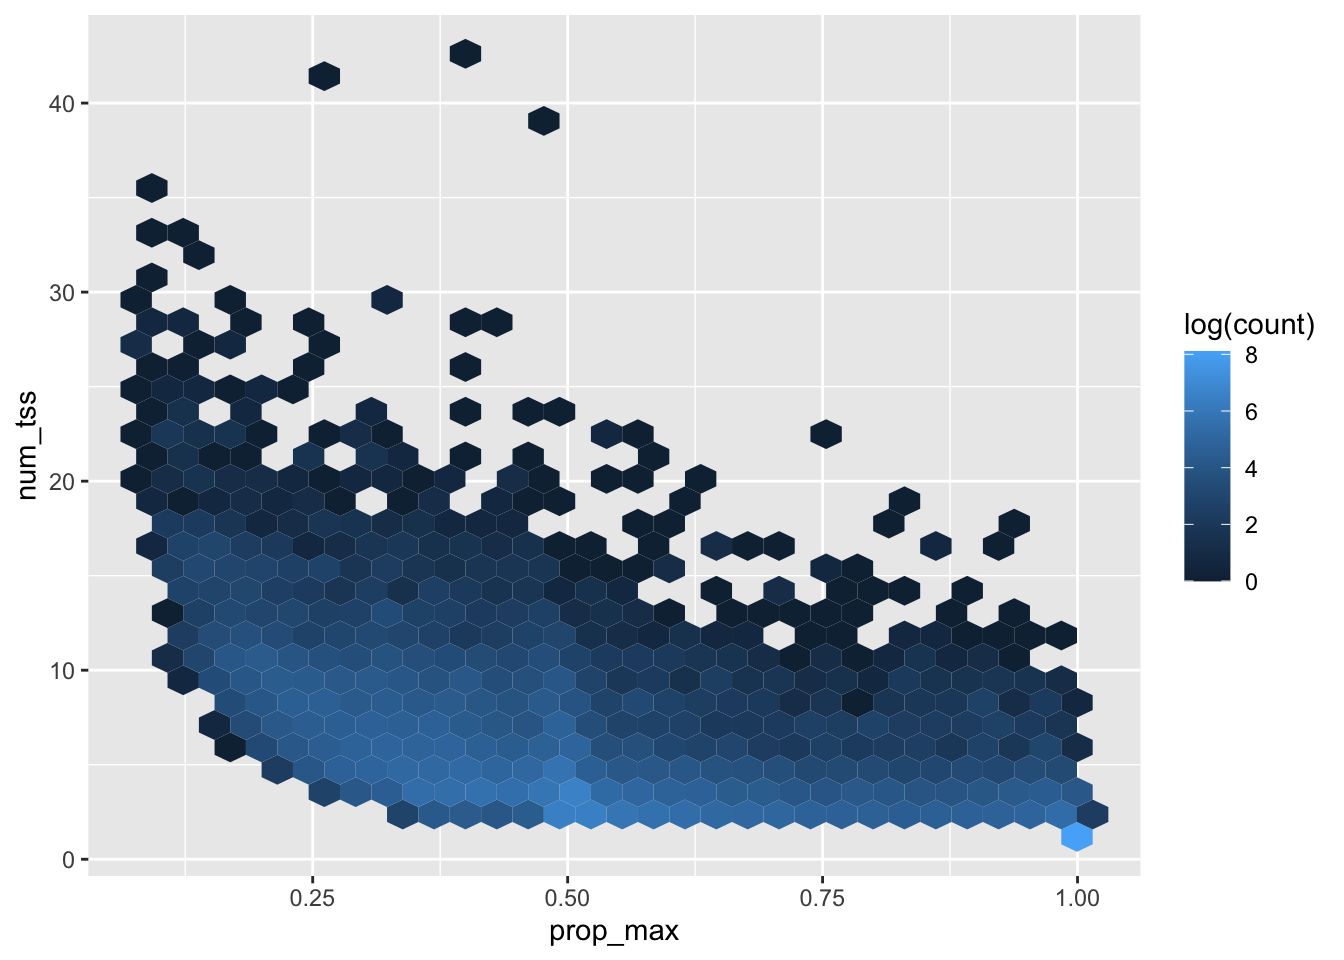
Last week I looked in-depth at the primary TSS quantification for ERAP2 and saw that using the primary TSS alone can be very misleading. Here I will extend across genes and look at the distribution of TSS expression in general. The goal is to justify the choice of quantification technique.
Excluding TSS sites outside of Enformer output window
One issue that causes the quantification to fail is when TSS sites collected from the annotation files fall outside the enformer output window. This mainly happens for larger genes. The simplest solution to this issue is to modify the tss specification file ahead of time rather than the quantification logic itself.
Quantificatin of a single individual at tss resolution across genes
For simplicity, I am going to quantify only a single individual and store quantifications for all TSS for all genes using the above filtered TSS sites
The following table summarizes this:
Code
files_path ="/Users/saideepgona/Library/CloudStorage/Box-Box/imlab-data/data-Github/analysis-Sai/enformer_geuvadis/CAGE_lcl_enformer_geuvadis_haplo1_all_tss.csv"prop_first = []num_tss = []c =0withopen(files_path,"r") as f:for line in f:if c ==0: c+=1continue p_line = line.strip().split(',')# print(p_line)if p_line[2] =='':continue vals = p_line[2].split(";") vals_num = [float(x) for x in vals] max_val =max(vals_num) sum_val =sum(vals_num) prop_first.append(max_val/sum_val) num_tss.append(len(vals_num)) c+=1withopen("/Users/saideepgona/Documents/PhD/imlab/Github_Repos/Daily-Blog-Sai/posts/2023-04-17-quantifying_tss_expression_across_sites/prop_first.txt", "w") as o:for i inrange(len(w_prop_first)): n_line = [str(w_prop_first[i]),str(num_tss[i])] o.write(",".join(n_line)+"\n")
---title: "quantifying_tss_expression_across_sites"author: "Saideep Gona"date: "2023-04-17"format: html: code-fold: true code-summary: "Show the code"execute: freeze: true warning: false---```{r}#| label: Set up box storage directorysuppressMessages(library(tidyverse))suppressMessages(library(glue))PRE ="/Users/saideepgona/Library/CloudStorage/Box-Box/imlab-data/data-Github/Daily-Blog-Sai"## COPY THE DATE AND SLUG fields FROM THE HEADERSLUG="quantifying_tss_expression_across_sites"## copy the slug from the headerbDATE='2023-04-17'## copy the date from the blog's header hereDATA =glue("{PRE}/{bDATE}-{SLUG}")if(!file.exists(DATA)) system(glue::glue("mkdir {DATA}"))WORK=DATA```## ContextLast week I looked in-depth at the primary TSS quantification for ERAP2 and saw that using the primary TSS alone can be very misleading. Here I will extend across genes and look at the distribution of TSS expression in general. The goal is to justify the choice of quantification technique.### Excluding TSS sites outside of Enformer output windowOne issue that causes the quantification to fail is when TSS sites collected from the annotation files fall outside the enformer output window. This mainly happens for larger genes. The simplest solution to this issue is to modify the tss specification file ahead of time rather than the quantification logic itself. ### Quantificatin of a single individual at tss resolution across genesFor simplicity, I am going to quantify only a single individual and store quantifications for all TSS for all genes using the above filtered TSS sitesThe following table summarizes this:```{python eval=FALSE}files_path ="/Users/saideepgona/Library/CloudStorage/Box-Box/imlab-data/data-Github/analysis-Sai/enformer_geuvadis/CAGE_lcl_enformer_geuvadis_haplo1_all_tss.csv"prop_first = []num_tss = []c =0withopen(files_path,"r") as f:for line in f:if c ==0: c+=1continue p_line = line.strip().split(',')# print(p_line)if p_line[2] =='':continue vals = p_line[2].split(";") vals_num = [float(x) for x in vals] max_val =max(vals_num) sum_val =sum(vals_num) prop_first.append(max_val/sum_val) num_tss.append(len(vals_num)) c+=1withopen("/Users/saideepgona/Documents/PhD/imlab/Github_Repos/Daily-Blog-Sai/posts/2023-04-17-quantifying_tss_expression_across_sites/prop_first.txt", "w") as o:for i inrange(len(w_prop_first)): n_line = [str(w_prop_first[i]),str(num_tss[i])] o.write(",".join(n_line)+"\n")``````{r}library(ggplot2)props_first <-read.csv("/Users/saideepgona/Documents/PhD/imlab/Github_Repos/Daily-Blog-Sai/posts/2023-04-17-quantifying_tss_expression_across_sites/prop_first.txt")colnames(props_first) <-c("prop_max","num_tss")hist(props_first$prop_max, breaks =40)ggplot(props_first) +geom_point(aes(x=prop_max,y=num_tss))ggplot(props_first) +geom_hex(aes(x=prop_max,y=num_tss))ggplot(props_first) +geom_hex(aes(x=prop_max,y=num_tss,fill =stat(log(count))))```