suppressMessages(library(tidyverse))suppressMessages(library(glue))PRE ="/Users/saideepgona/Library/CloudStorage/Box-Box/imlab-data/data-Github/Daily-Blog-Sai"## COPY THE DATE AND SLUG fields FROM THE HEADERSLUG="training_small_input_enformer"## copy the slug from the headerbDATE='2023-05-24'## copy the date from the blog's header hereDATA =glue("{PRE}/{bDATE}-{SLUG}")if(!file.exists(DATA)) system(glue::glue("mkdir {DATA}"))WORK=DATA
Context
The main questions we wanted to answer during the Hackathon were:
1.) Can we train pytorch Enformer in a distributed fashion? 2.) Does trianing using population sequence help improve Enformer performance?
Distributed Training
The following figure use DDP, I will further test DeepSpeed a bit later.
GPU Utilization
During the hackathon we noticed some issues with GPU utilization during the distributed training. The training did seem to be working, but it was much slower than expected and had the following GPU utilization chart:
This figure implies that the GPUs are only being utilized to a significant extent every 20 minutes. This is in a single node configuration with 4 GPUS for which the communication overhead should be very limited.
At the time it was unclear what was causing this, but it helps to look at a chart of actual time since the launch of training (like the x axis above) and the “pseudotime” of training iteration progression. Here, the training iterations are on the x-axis and the time (seconds) is on the y:
From this it can be extrapolated that the spikes in GPU utilization are happening when the training is occurring, which is then punctuated by noticeable gaps. It turns out that the gaps correspond to periods of validation testing which are not implemented efficiently. Since this training dataset has already been used before, I’ve just temporarily removed the validation testing so that the training can be allowed to proceed and we can test the scaling better. Normally, you would want a better validation testing to check for overfitting. We can now test using 10 and 60 nodes as well to observe performance:
It seems that at higher levels of parallelization, the GPU utilization per GPU drops quite a bit. Presumably this is because of communication overhead.
Training Speed
GPU utilization is an important metric for diagnosing any issues with the distributed training. Still, we would really like to know how fast the training is happening. Number of training iterations is not a good metric here, as the training examples per iteration varies depending on the batch size (this in turn varies depending on the number of GPUs in parallel). Instead, time per epoch gives a better metric of training speed since it tells you how quickly the overall training passes through the whole training set. You can then extrapolate to estimate total required training time.
To help get to this, we can first look at roughly how much time it takes to run each iteration. The following chart shows iterations vs training time. You can see that despite increased parallelization overhead, the time per iteration doesn’t seem to increase too rapidly.
Along with this is the number of epochs covered:
From this, you can see that there is a large speedup in training speed from increased parallelization. I do not currently have epochs as a function of time logged, though this is something I should add (can be roughly computed from existing information).
Discussion of batch sizes
Unfortunately, there is a tradeoff to having too many training nodes in parallel. What happens is that the effective batch size per iteration increases. This means that the number of training examples observed per SGD weight update also increases. Further discussion of this topic can be found here:https://medium.com/mini-distill/effect-of-batch-size-on-training-dynamics-21c14f7a716e .
How to use wandb
Source Code
---title: "training_small_input_enformer"author: "Saideep Gona"date: "2023-05-24"format: html: code-fold: true code-summary: "Show the code"execute: freeze: true warning: false---```{r}#| label: Set up box storage directorysuppressMessages(library(tidyverse))suppressMessages(library(glue))PRE ="/Users/saideepgona/Library/CloudStorage/Box-Box/imlab-data/data-Github/Daily-Blog-Sai"## COPY THE DATE AND SLUG fields FROM THE HEADERSLUG="training_small_input_enformer"## copy the slug from the headerbDATE='2023-05-24'## copy the date from the blog's header hereDATA =glue("{PRE}/{bDATE}-{SLUG}")if(!file.exists(DATA)) system(glue::glue("mkdir {DATA}"))WORK=DATA```# ContextThe main questions we wanted to answer during the Hackathon were:1.) Can we train pytorch Enformer in a distributed fashion?2.) Does trianing using population sequence help improve Enformer performance?## Distributed TrainingThe following figure use DDP, I will further test DeepSpeed a bit later.### GPU UtilizationDuring the hackathon we noticed some issues with GPU utilization during the distributed training. The training did seem to be working, but it was much slower than expected and had the following GPU utilization chart: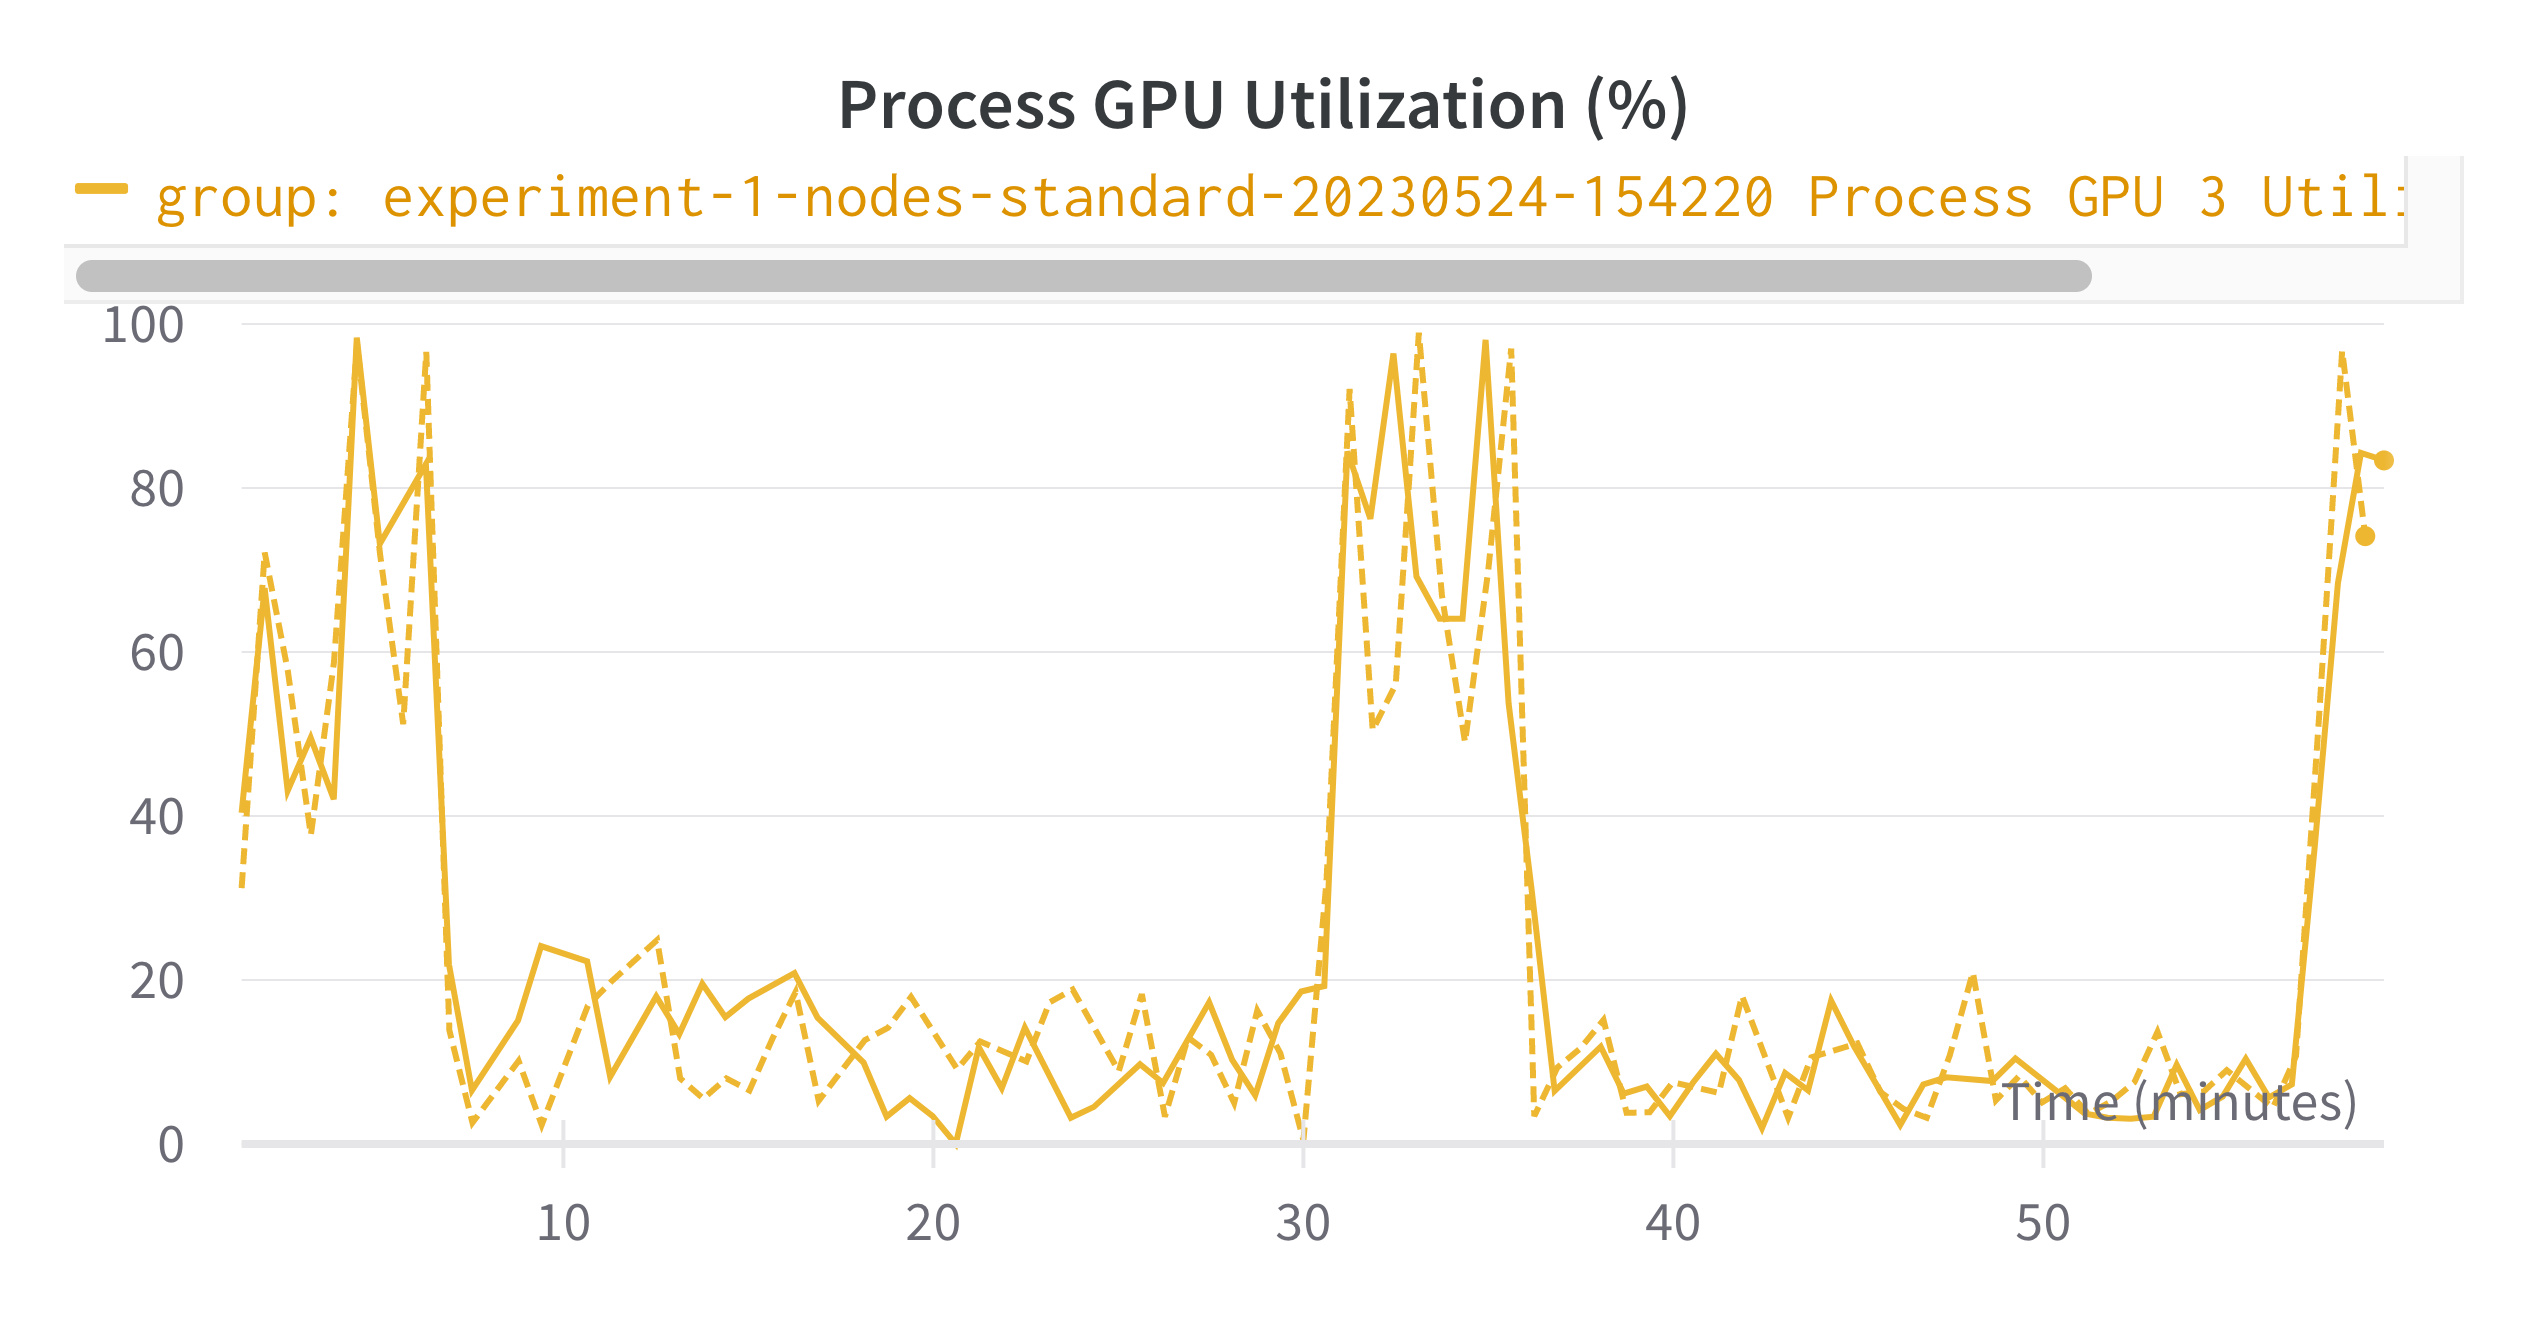This figure implies that the GPUs are only being utilized to a significant extent every 20 minutes. This is in a single node configuration with 4 GPUS for which the communication overhead should be very limited.At the time it was unclear what was causing this, but it helps to look at a chart of actual time since the launch of training (like the x axis above) and the "pseudotime" of training iteration progression. Here, the training iterations are on the x-axis and the time (seconds) is on the y: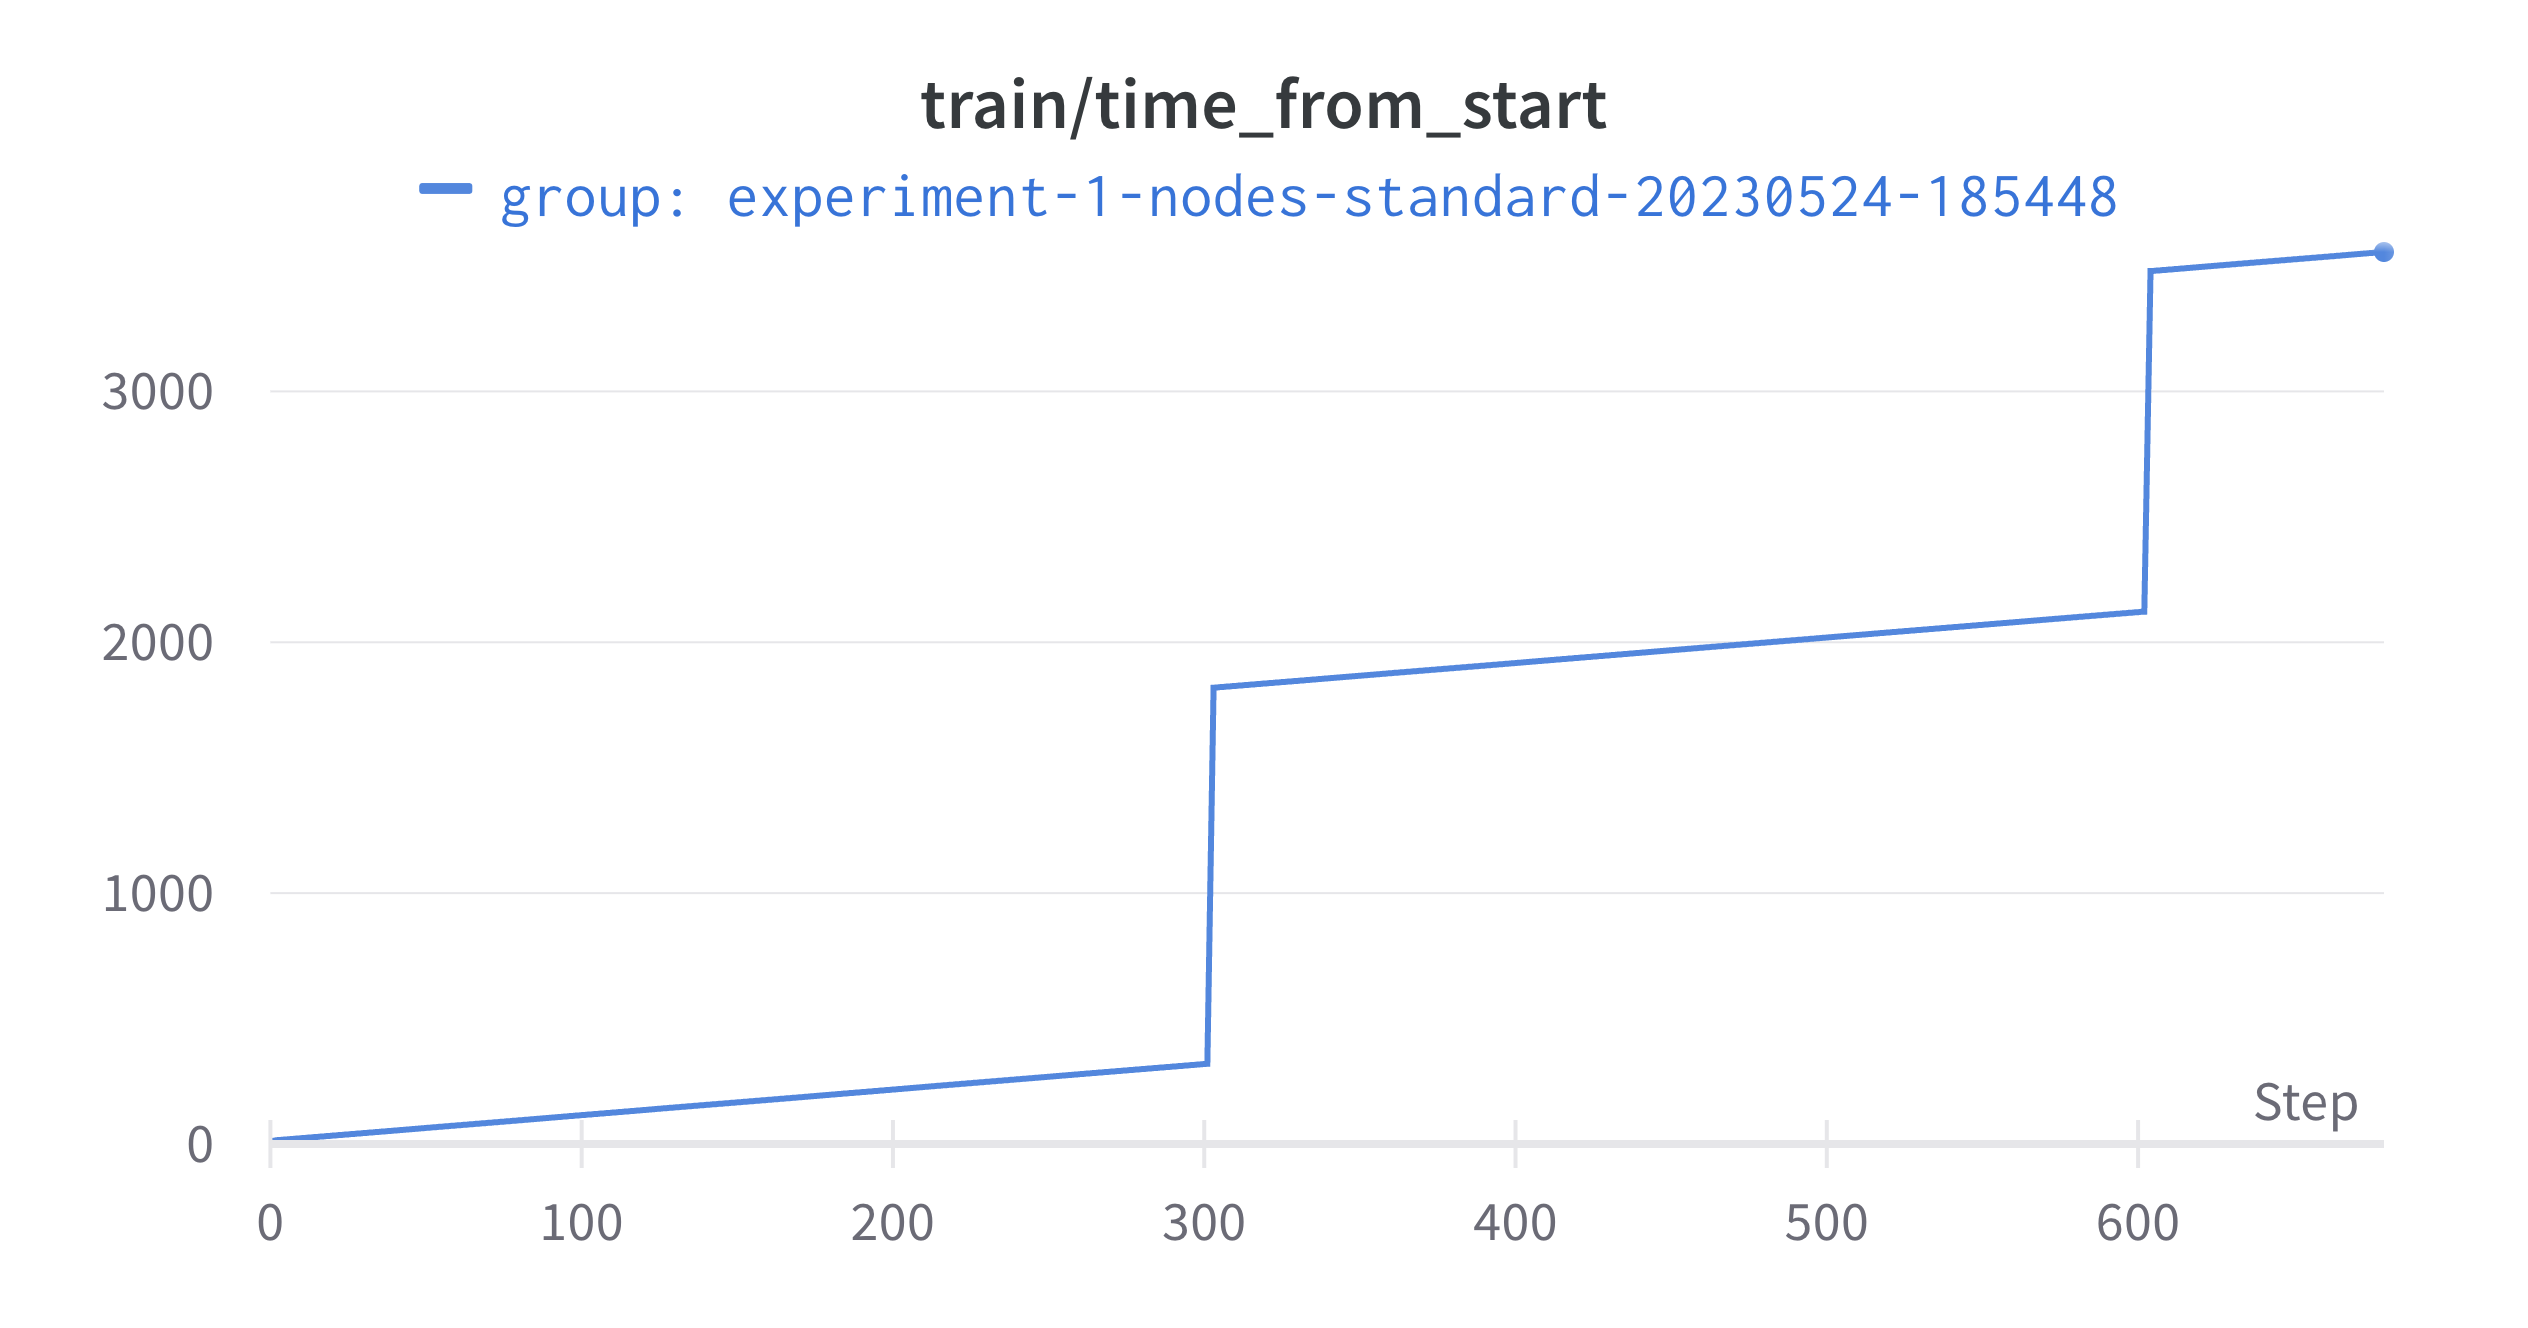From this it can be extrapolated that the spikes in GPU utilization are happening when the training is occurring, which is then punctuated by noticeable gaps. It turns out that the gaps correspond to periods of validation testing which are not implemented efficiently. Since this training dataset has already been used before, I've just temporarily removed the validation testing so that the training can be allowed to proceed and we can test the scaling better. Normally, you would want a better validation testing to check for overfitting. We can now test using 10 and 60 nodes as well to observe performance: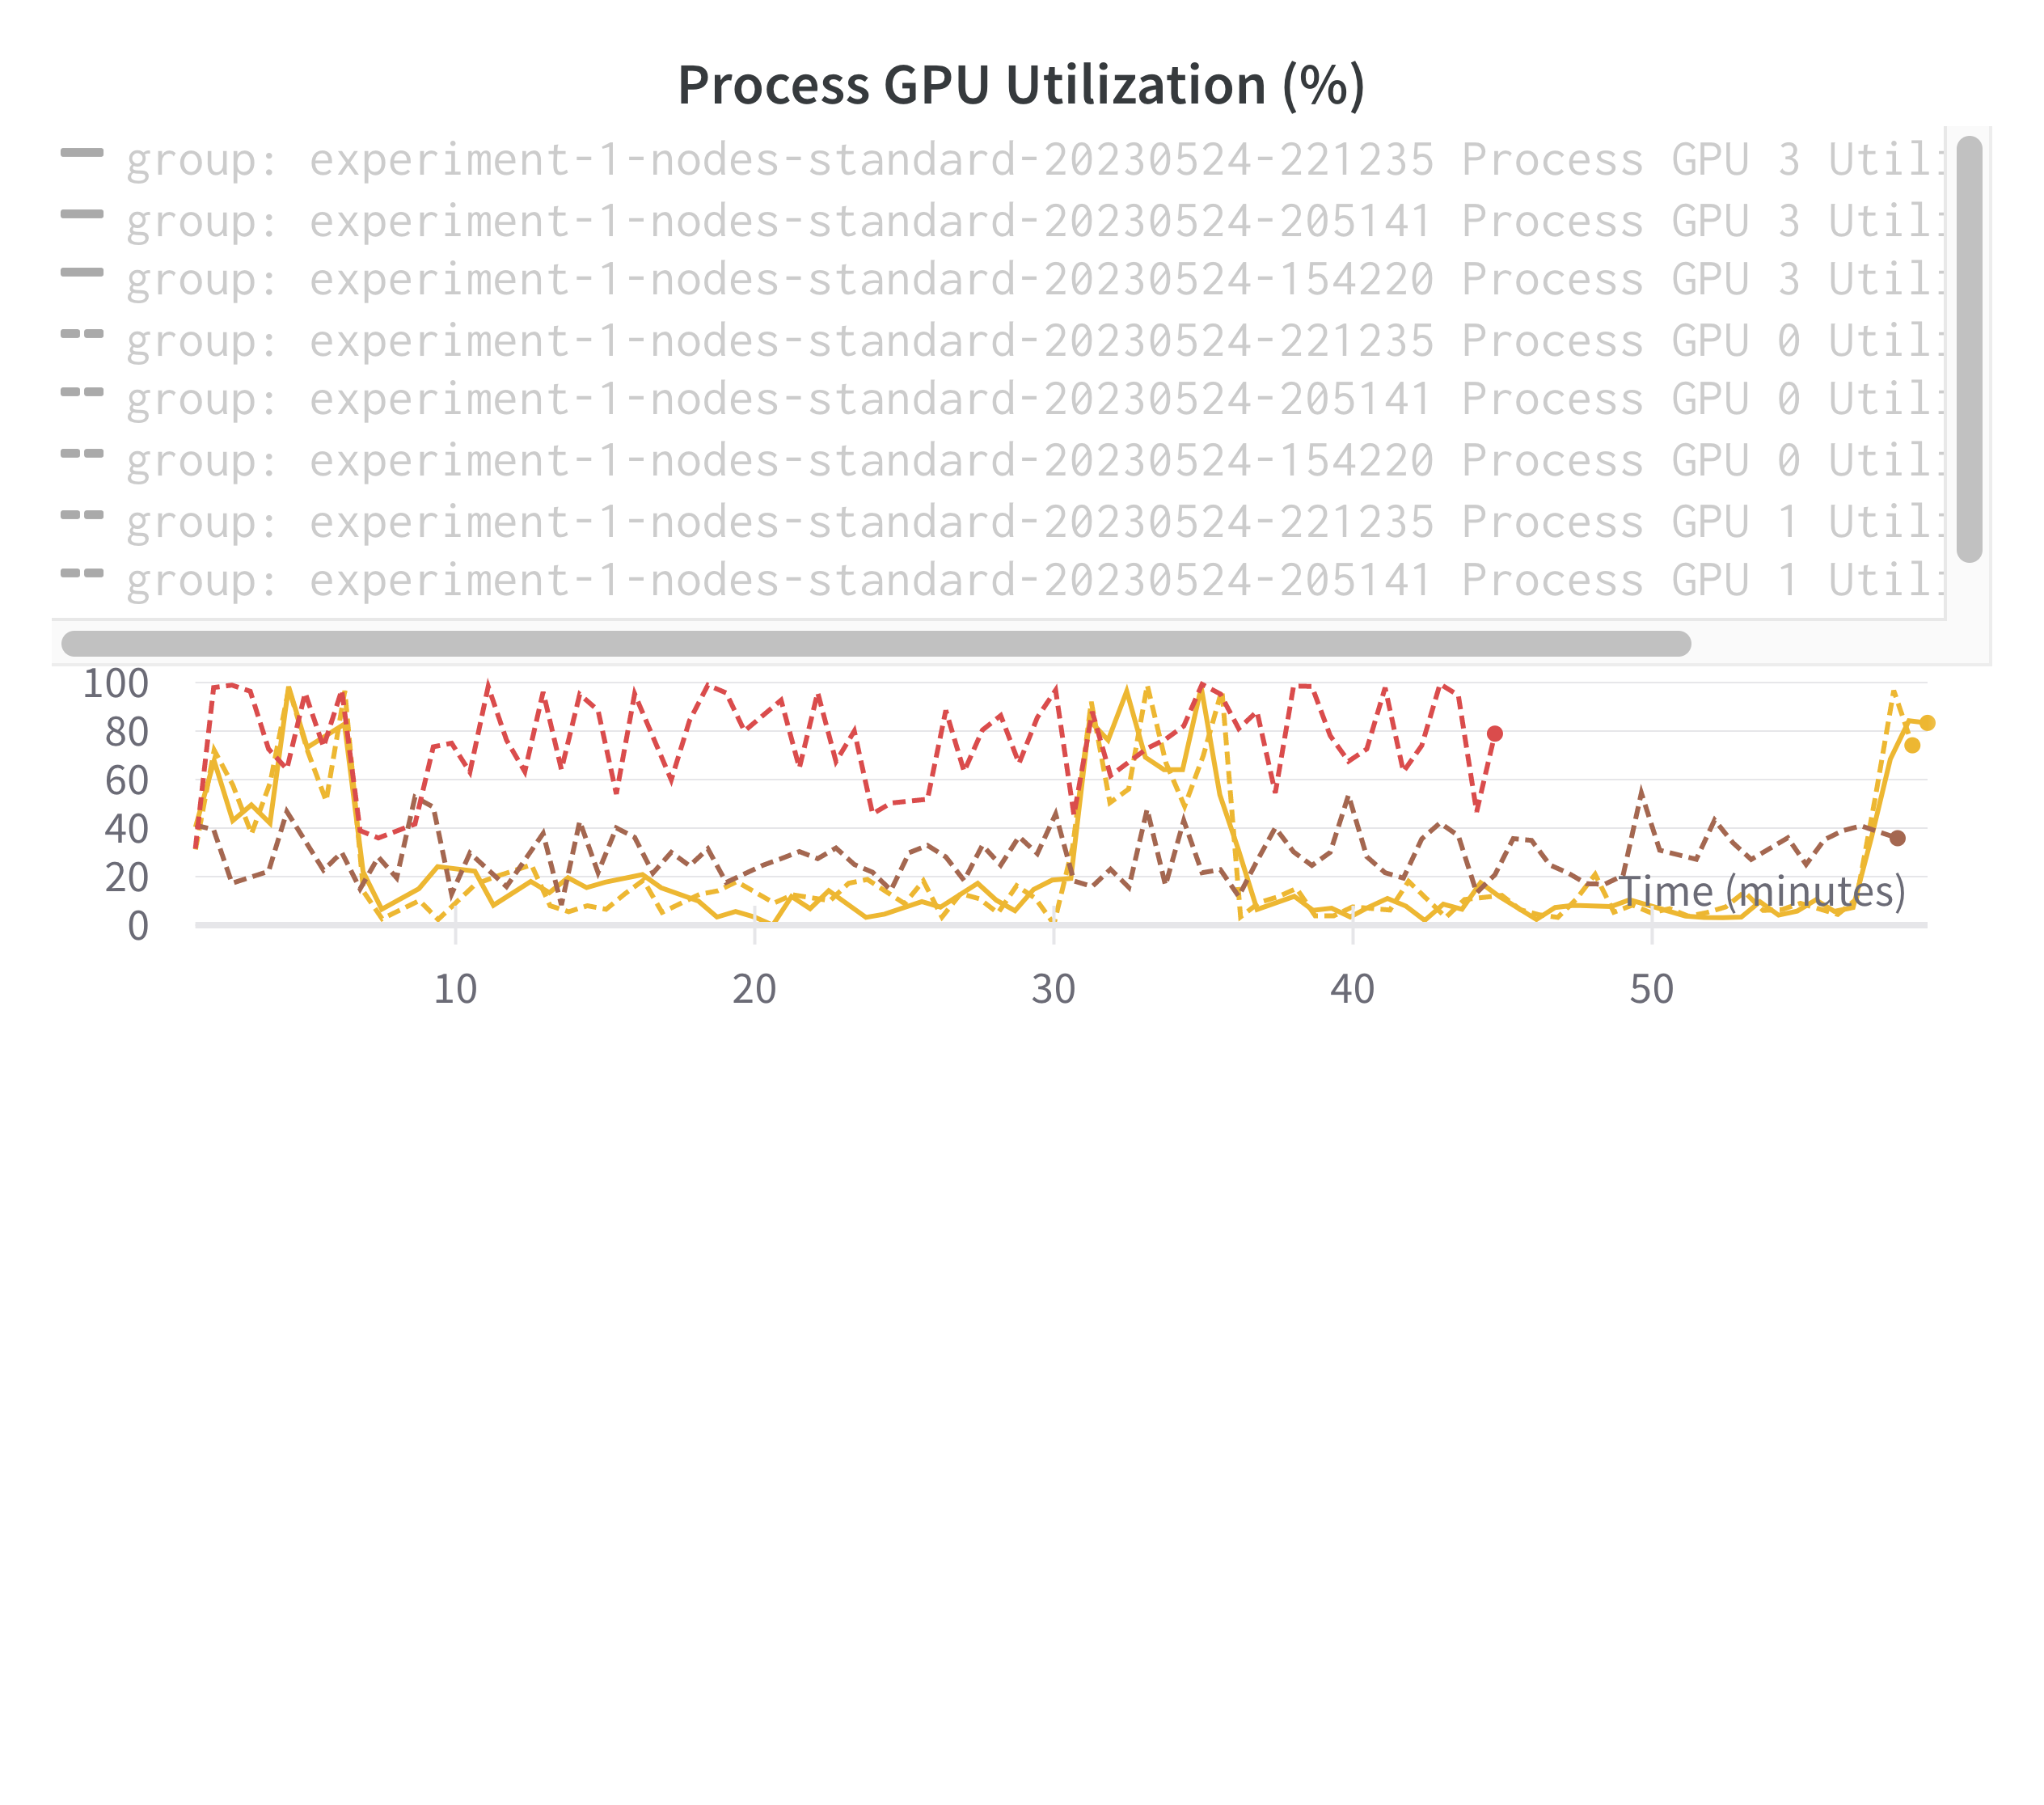It seems that at higher levels of parallelization, the GPU utilization per GPU drops quite a bit. Presumably this is because of communication overhead.### Training SpeedGPU utilization is an important metric for diagnosing any issues with the distributed training. Still, we would really like to know how fast the training is happening. Number of training iterations is not a good metric here, as the training examples per iteration varies depending on the batch size (this in turn varies depending on the number of GPUs in parallel). Instead, time per epoch gives a better metric of training speed since it tells you how quickly the overall training passes through the whole training set. You can then extrapolate to estimate total required training time. To help get to this, we can first look at roughly how much time it takes to run each iteration. The following chart shows iterations vs training time. You can see that despite increased parallelization overhead, the time per iteration doesn't seem to increase too rapidly.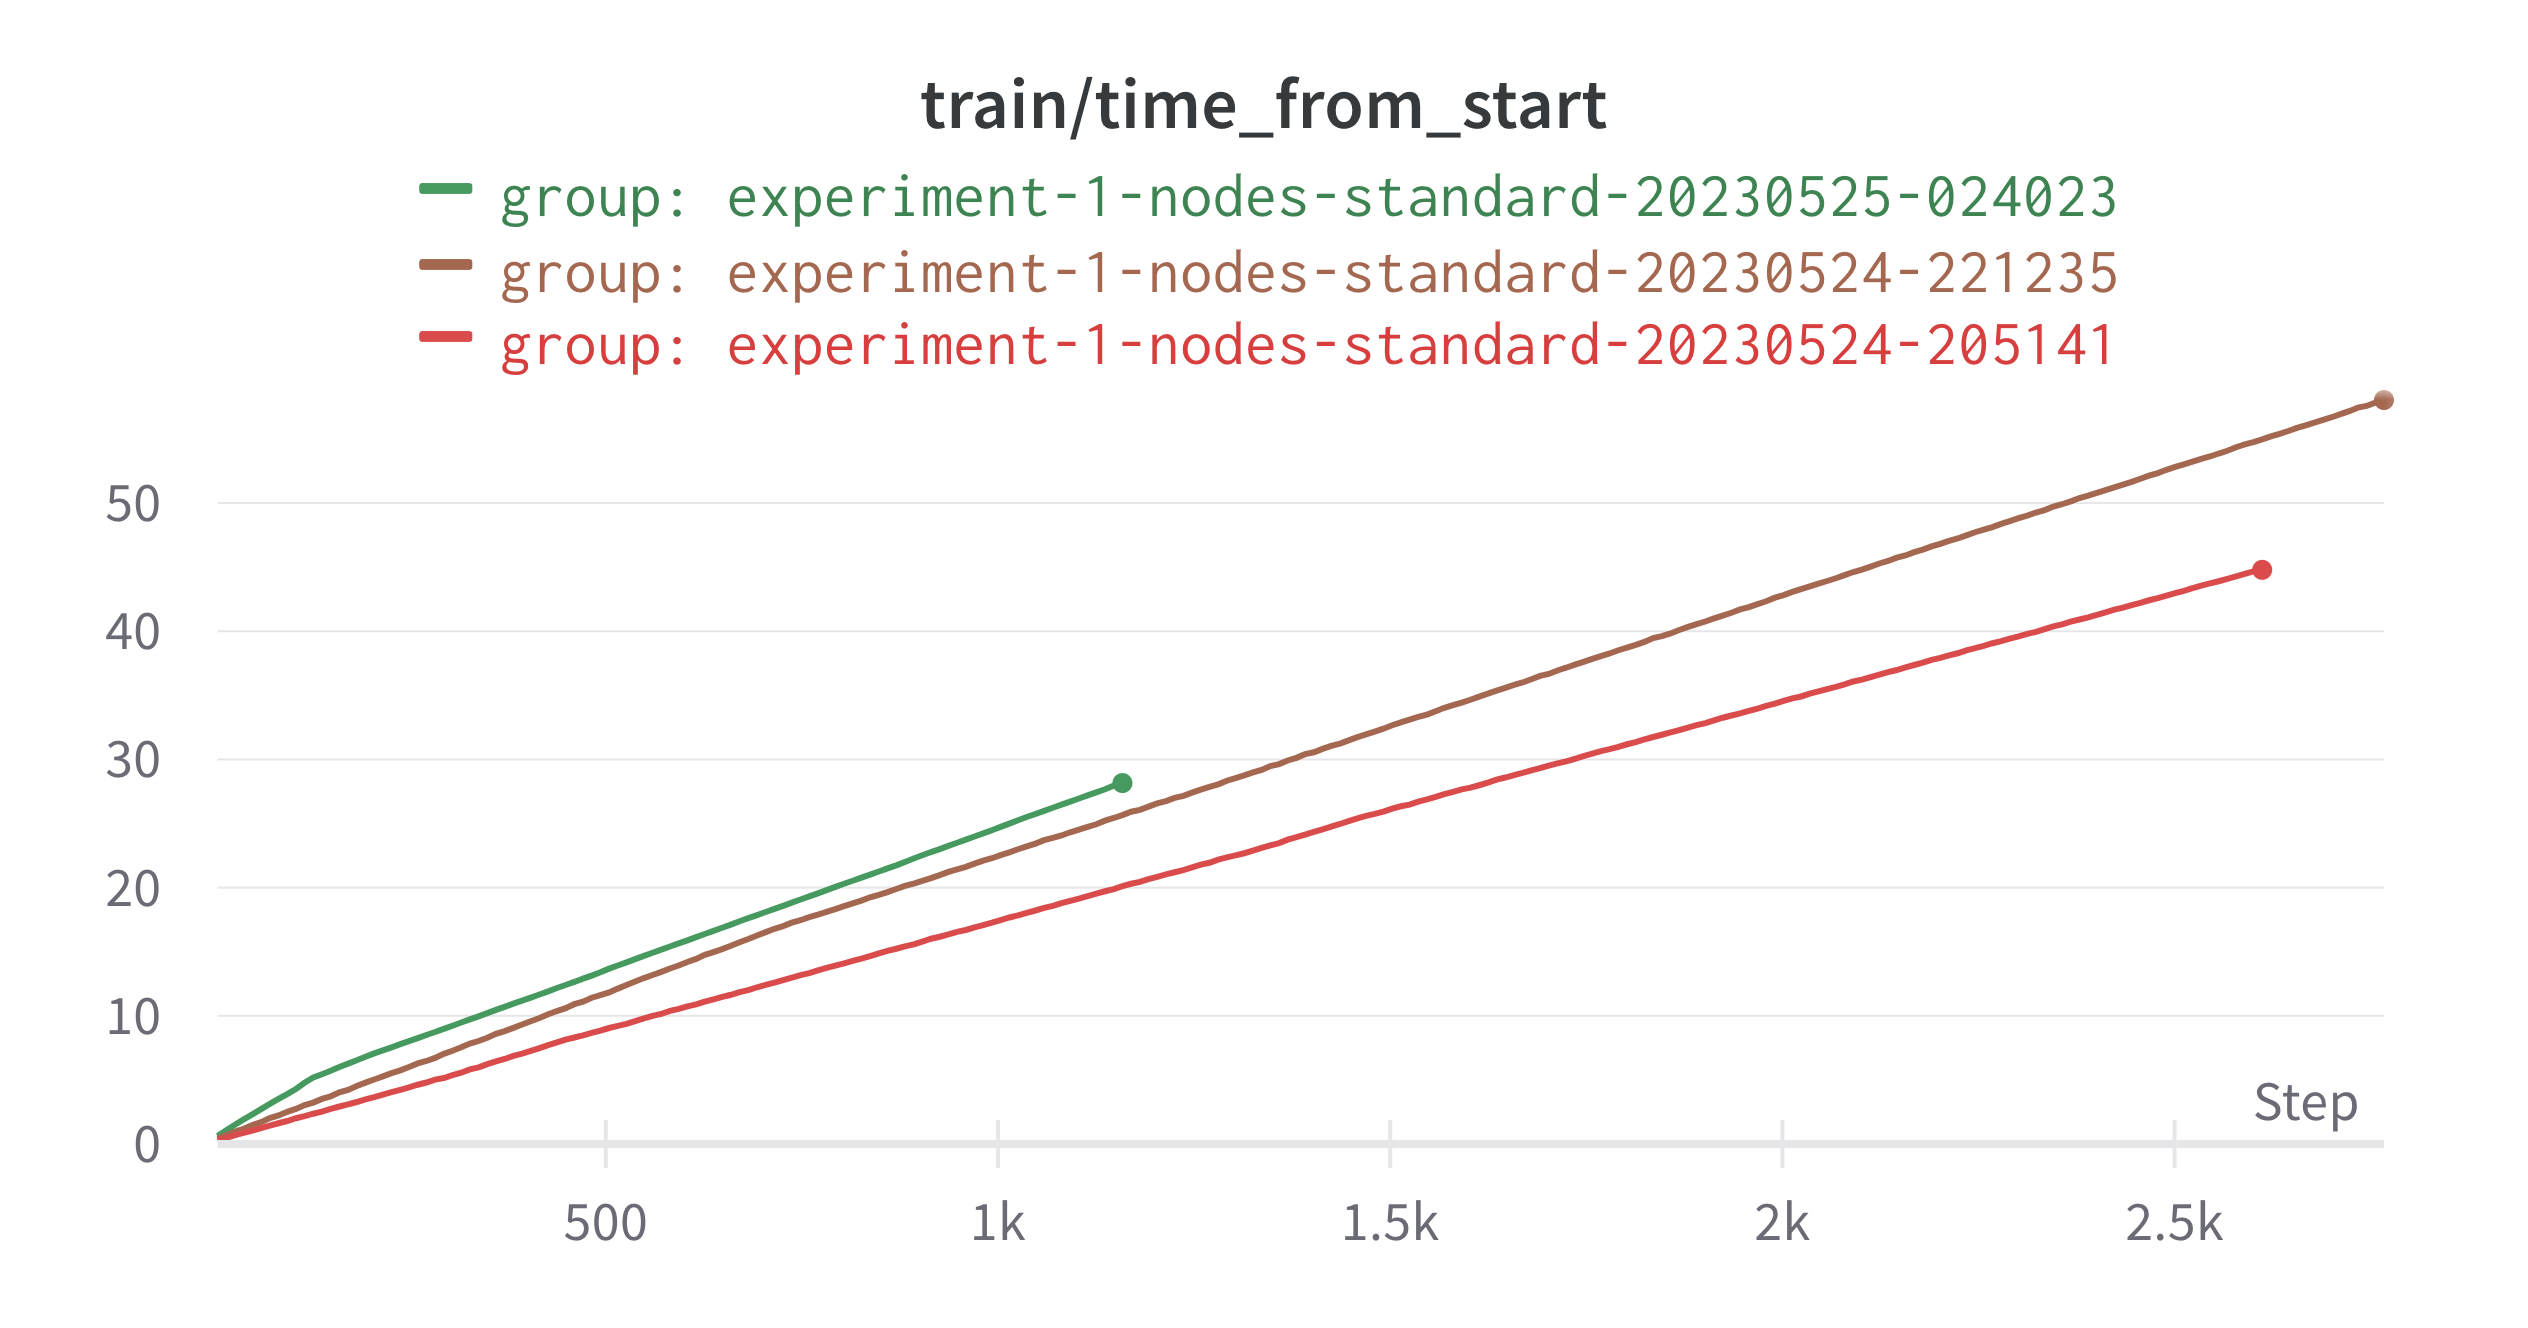Along with this is the number of epochs covered: 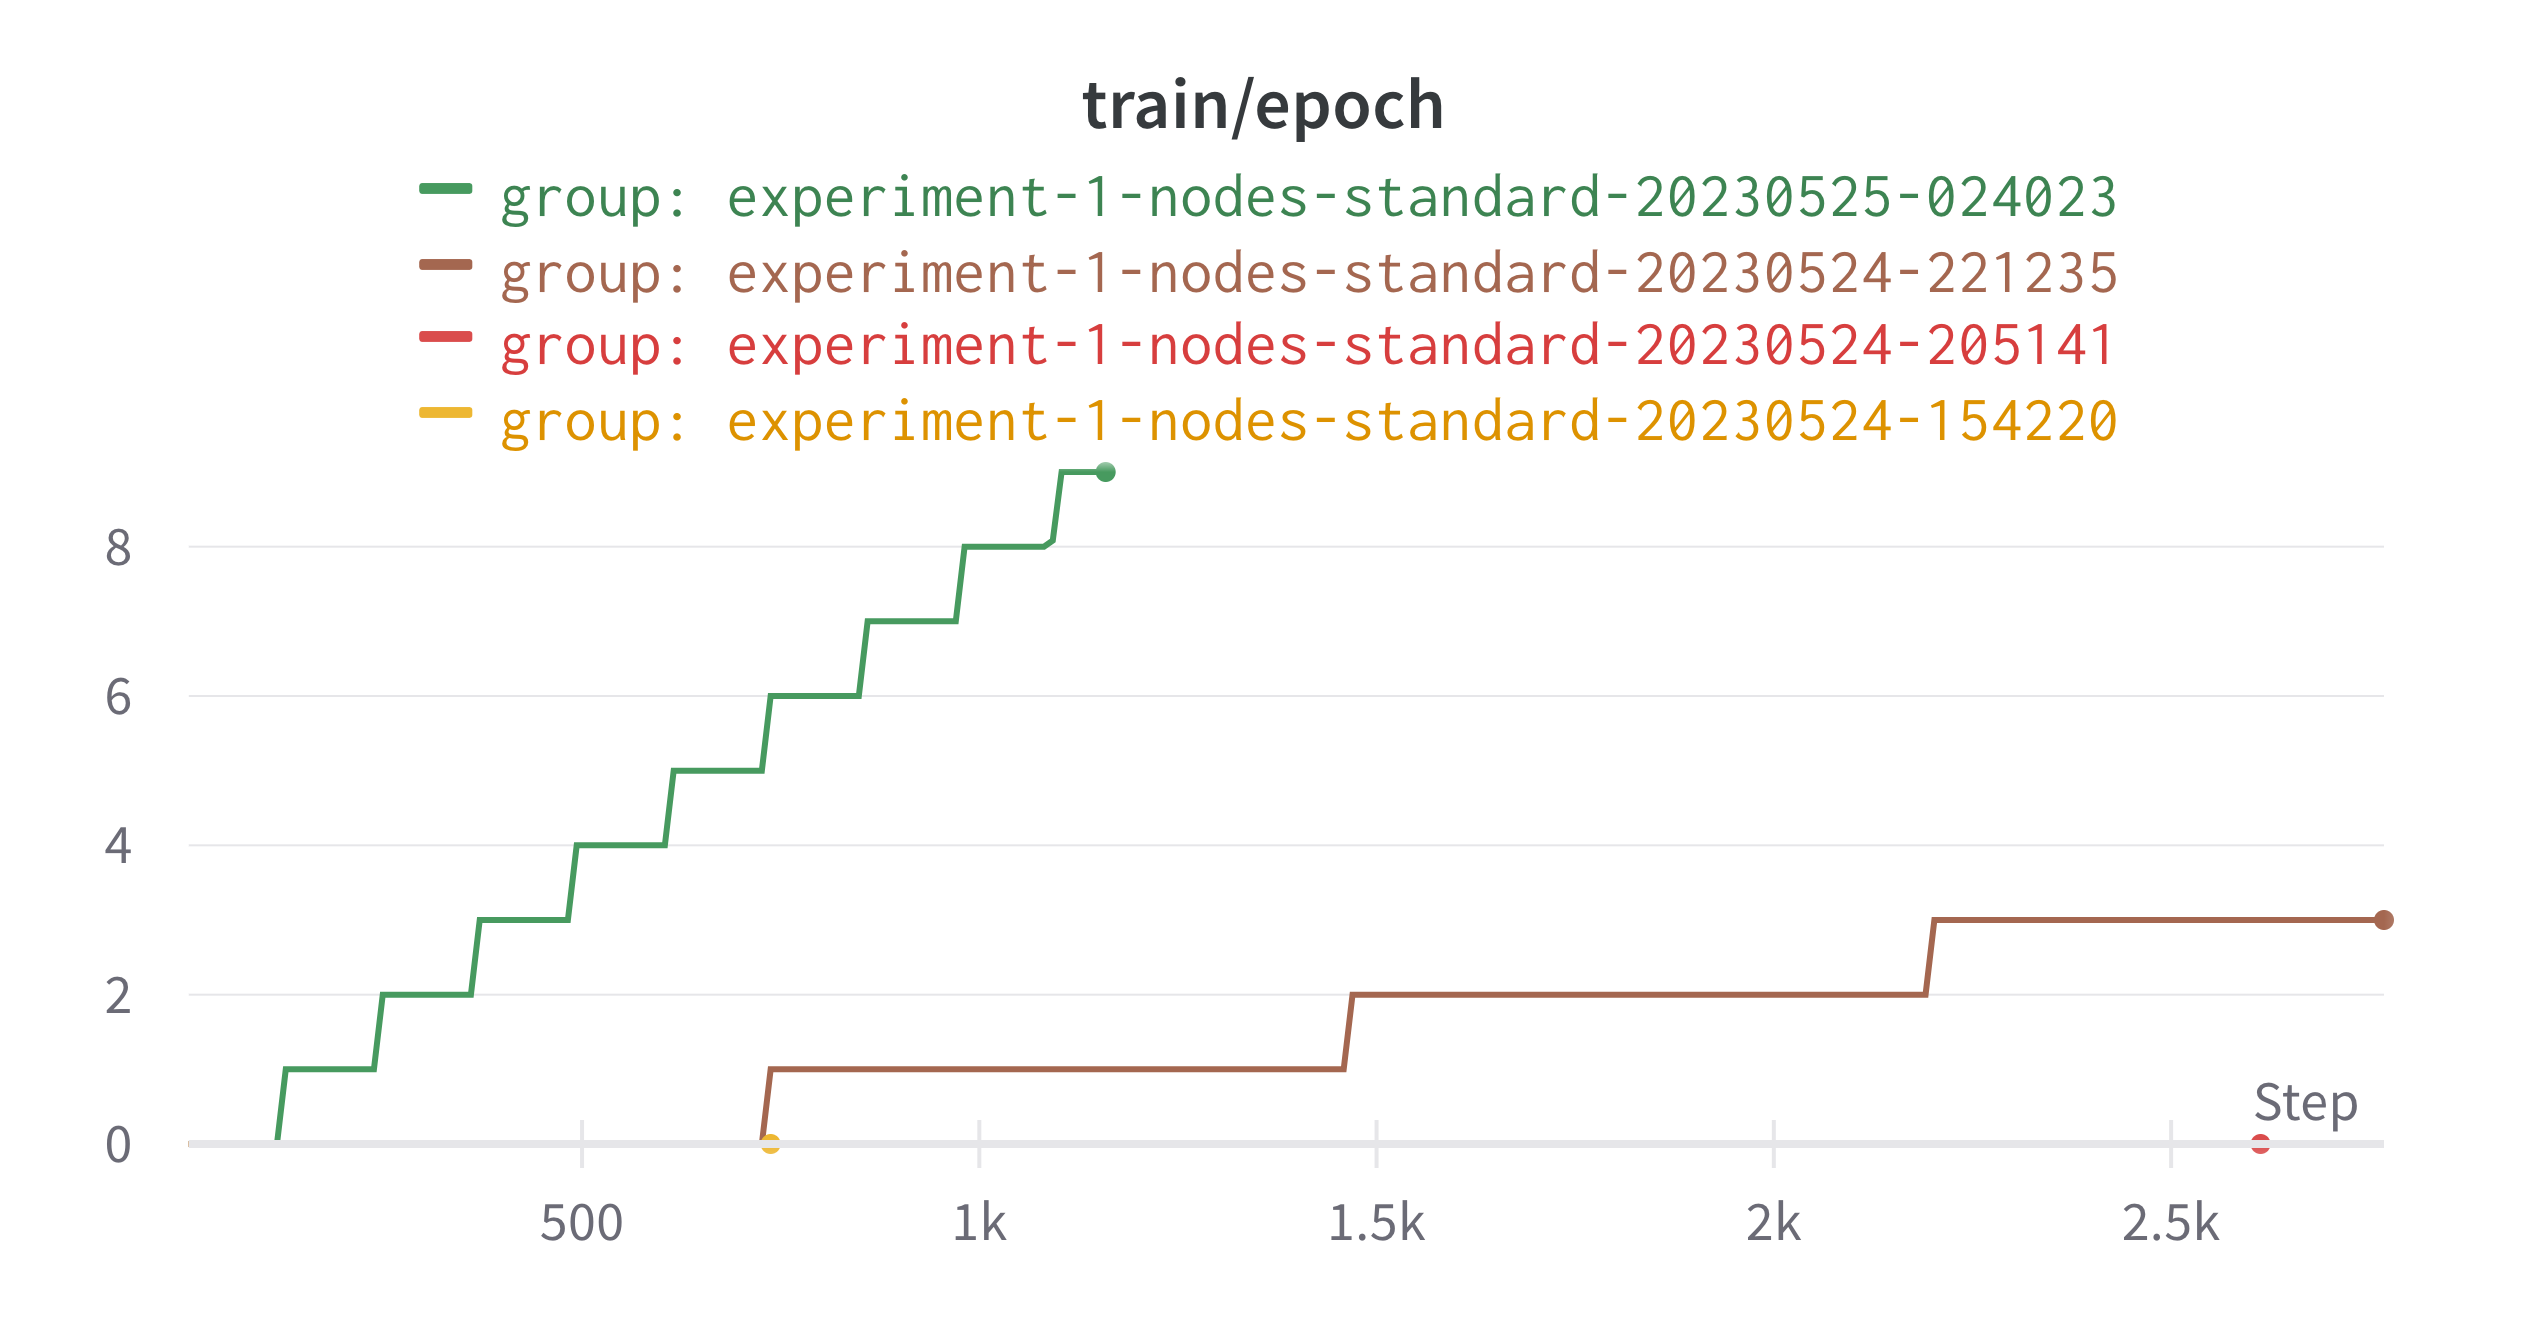From this, you can see that there is a large speedup in training speed from increased parallelization. I do not currently have epochs as a function of time logged, though this is something I should add (can be roughly computed from existing information).### Discussion of batch sizesUnfortunately, there is a tradeoff to having too many training nodes in parallel. What happens is that the effective batch size per iteration increases. This means that the number of training examples observed per SGD weight update also increases. Further discussion of this topic can be found here:https://medium.com/mini-distill/effect-of-batch-size-on-training-dynamics-21c14f7a716e . ### How to use wandb